
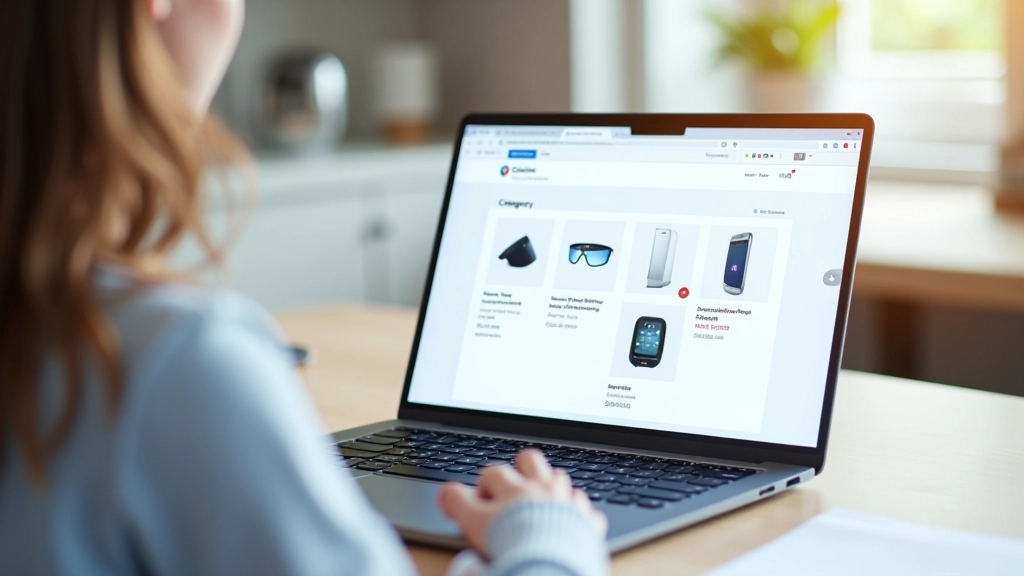
Category Architecture: Building Structures That Search Engines Understand
How to organize product categories hierarchically so search engines can crawl everything efficiently and users find what they need.
Traffic and rankings aren't enough. We break down click-through rates, internal linking patterns, and how to identify category pages that are underperforming in search.


Most e-commerce teams track organic traffic and keyword rankings. That's a start. But if you're only watching those numbers, you're missing the real story. Category pages aren't regular content pages — they're gateways. They funnel customers toward products, and the quality of that funnel determines whether you're actually converting visitors or just getting clicks.
Here's the thing: you can rank first for "men's running shoes" and still lose customers if your category page isn't structured right. The metrics that matter aren't always the ones you'd expect. We've seen category pages with solid traffic that drove almost no product page visits. That's the gap we're here to fill.

Click-through rate (CTR) is your first real signal. It's not just about rankings — it's about whether searchers actually want to click your result. A category page ranking third with a 6% CTR will outperform a first-place ranking with a 2% CTR every single time. We've tracked this across hundreds of Montreal-based e-commerce sites. The difference comes down to your title tag and meta description. They need to speak to what searchers are actually looking for.
Then there's the metric most teams ignore: internal link flow. This one's critical. Your category page should be receiving links from your homepage, related category pages, and relevant blog content. If a category page gets organic traffic but no internal links from high-authority pages, you're wasting potential. Count your internal links pointing to each category page. The ones with the fewest links? Those are your underperformers.
Key insight: A category page with 200 organic visits and 15 internal links pointing to it will typically drive more product page clicks than a page with 500 visits and only 3 internal links.
This is where most analysis stops being obvious. You need to know: what percentage of people who land on your category page actually click through to a product page? We call this the "internal conversion rate," and it's absolutely crucial. If you're getting 1,000 category page visitors per month but only 120 are clicking to products, that's a 12% rate. That's weak.
A healthy category page typically sees 25-40% of visitors clicking to at least one product. Below 15%? There's a structural problem — either your filtering system is confusing, your product images aren't compelling, or your page layout is pushing people away. You can identify this using Google Analytics 4 events. Set up click tracking on your product links and measure the engagement rate.

Bounce rate is misleading on category pages. A visitor might land, scroll through filters, decide nothing matches what they're looking for, and leave. That's a bounce, but it doesn't mean your page failed — the page actually worked correctly by showing the visitor that you don't have what they need.
What you should track instead is scroll depth. How far down the page do visitors scroll? Are they seeing your filter options? Are they reaching the bottom where you might have related categories or bestseller recommendations? If 70% of visitors bounce before scrolling past the first 3 products, your page layout needs adjustment. Consider moving filters above the fold, or reorganizing your product grid.
Don't forget about filter usage. This is gold. If you're tracking which filters people use, you'll see patterns. "Size" might be used 60% of the time while "color" is only 10%. That tells you what matters to your customers. The filters that get heavy use should be prominent. The ones no one touches? They're cluttering your page.
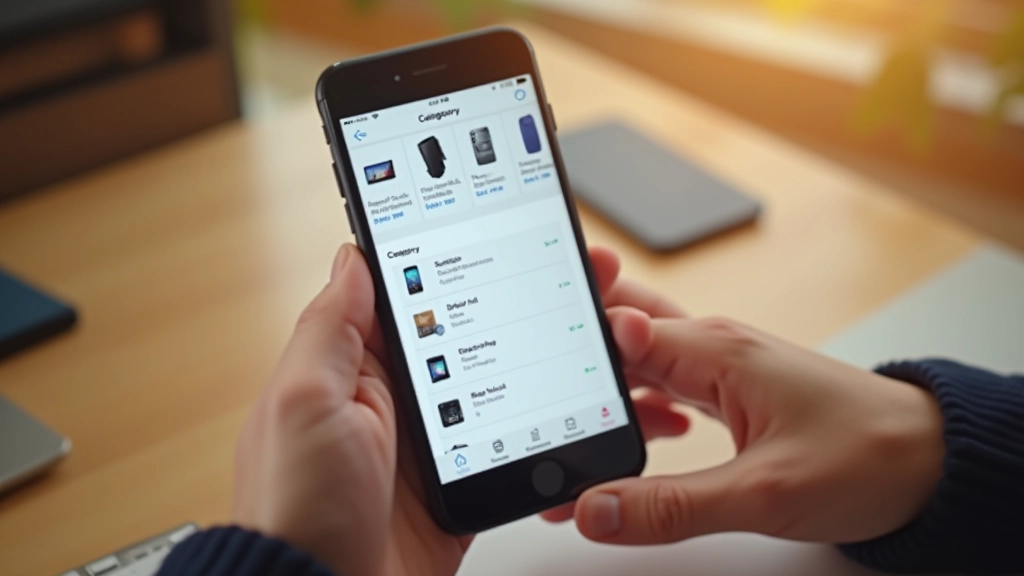
Here's a framework we use. Create a spreadsheet. List every category page. For each one, measure: organic traffic, average ranking position, CTR, internal links pointing to it, and product page click rate. Now rank them. The pages with decent traffic but low click-through to products? Those are your priorities. They're broken funnels.
A category ranking for 80 keywords but only getting 200 clicks to products each month is underperforming. You've got visibility. The problem's downstream. Could be a layout issue. Could be that your product thumbnails are too small. Could be that your price filtering isn't working properly. But you won't know unless you look at user behavior data.
Time on page matters, but not the way you think. Longer isn't always better. If people spend 3 minutes on a category page and don't click anything, that's not engagement — that's frustration. They're searching for something they can't find. If they spend 45 seconds and click to a product? That's efficiency. That's a win.
Note: Results vary depending on your product catalog size, industry, and audience. These metrics are guidelines, not guarantees. What works for a 500-product store might need adjustment for a 50,000-product catalog.
You don't need fancy tools to start. Google Analytics 4 gives you everything you need. Set up event tracking on product links. Create a custom report grouping pages by template (all category pages together). Then look for patterns. Which categories are performing? Which ones are dragging? Start there.
The real value comes from treating category pages as their own beast. They're not blog posts. They're not product pages. They're transition points. Optimize them with metrics that reflect that role — CTR, internal link flow, product page click rates, and user behavior signals. That's where the opportunity lives.

Dive deeper into e-commerce SEO optimization
How to organize product categories hierarchically so search engines can crawl everything efficiently and users find what they need.

Filter pages create duplicate content problems. Here's how to implement dynamic filtering without tanking your search visibility.

Mobile users filter differently than desktop users. Learn pagination versus infinite scroll and how each affects SEO performance.